How to Display Timelines on Your Sports Team Website
Ask any sports enthusiast what they remember most about a particular game, and they will probably be able to tell you when a deciding moment was played. It’s no secret that the most passionate sports fans remember the exact minute when their favorite player scored or got penalized.
As a sports fan yourself, you know how easy it is to remember those moments if you watch the game at home or if you attend it live.
But what happens when your fans can’t make it to the game, no matter how hard they try? How do they stay in the loop?
That’s where statistics come into play. While some may argue that statistics don’t matter for some sports or at all, there are those who believe keeping track of certain metrics is crucial for improving your strategy.
Why Should You Display Statistics For Your Events?
When it comes to sports statistics, some may argue that keeping track of minute details doesn’t matter for certain sports, or at all for that matter. On the other hand, there are those who believe that keeping track of those metrics is crucial for improving your team strategy. Regardless of which camp you belong to, there is no doubt that statistics can be a valuable tool.
If you manage a sports team, having a reference of timed statistics can help you refer back to those moments in your team’s play history and analyze what happened. You can get a glimpse of a player’s performance, which allows you to compare it to other games.
Your team members can use the data in a similar fashion and work on improving a specific aspect of their game.
Fans, on the other hand, love to discuss all the details of a match and keep track of their favorite player’s scores, penalties, and other information that shows how deeply involved they are with their team.
How to Display Statistics On Your Site
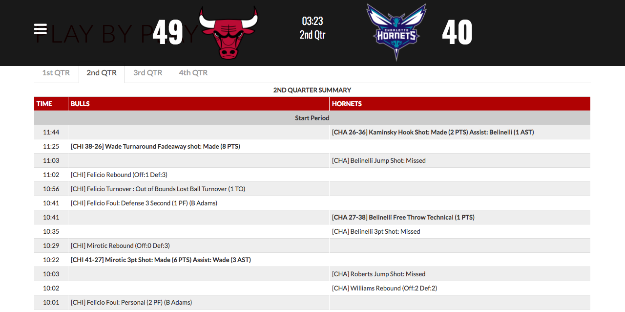
One of the most common ways of presenting game statistics is by using tables. Almost every major team does it, similarly to the Chicago Bulls’ statistics breakdown:
Presenting game statistics in tables is useful, but a table is not always so easy to follow. Luckily, there is a way to make statistics easier to understand and look more appealing – and that’s by displaying a timeline of the entire match.
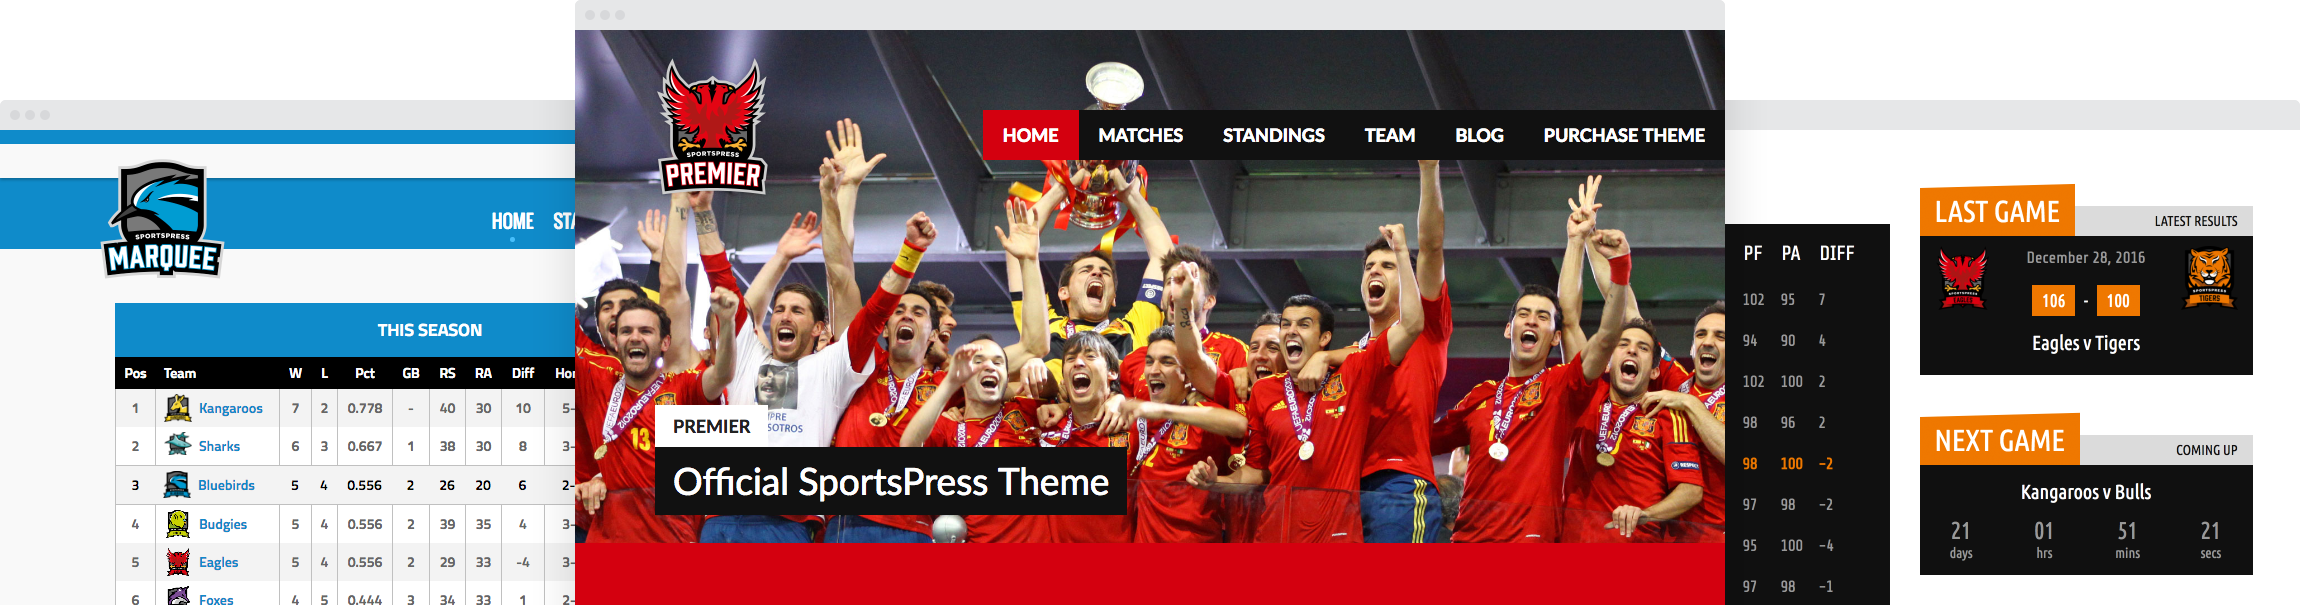
That is why our latest SportsPress update introduced a new Timelines Module in the Pro version of the plugin. It’s a new way to see the timed statistics and make them visually more interesting.
In today’s post, we’ll give you a more detailed overview of how to enable the Timelines, how to use them with your existing matches, and how to populate the module with new data.
How to Use the Timelines Module in SportsPress Pro
If you’ve been using the Pro version of our plugin, you probably know that we added the ability to display minutes in the box score. The new Timelines Module displays those minutes and the timed statistics as a horizontal timeline which is placed across the top of the event pages.

The good news is that if you have been tracking player performance with our plugin before, you won’t have to import the data again – the plugin will automatically pull the information for existing events.
Not only that, but the icons that represent the timed metrics will be placed on the correct spot in the timeline thanks to the Full Time setting in each event. With that in mind, let’s walk through the steps to enable the Timeline module.
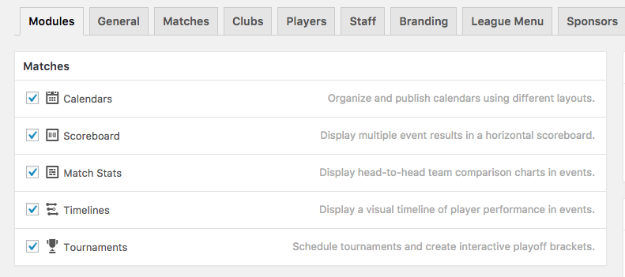
1. Enable The Module
Before you can use the Timelines Module, you’ll have to update the plugin to the latest version. You can do so manually from your WordPress dashboard or you can download the latest version of the plugin from your account area.
Once you’ve updated the plugin, the new module will instantly be available under SportsPress Settings & Modules. You can toggle the module on or off if you decide you don’t want to use it. Note that if you’re just getting started with the SportsPress Pro plugin, the Timelines module will be enabled by default.
After you have enabled the module, you need to set it up so the data from the score box displays in a visual timeline format.
First, click on the Events tab and drag the module to where you want it to display. Save changes, and then click on SportsPress > Configure.
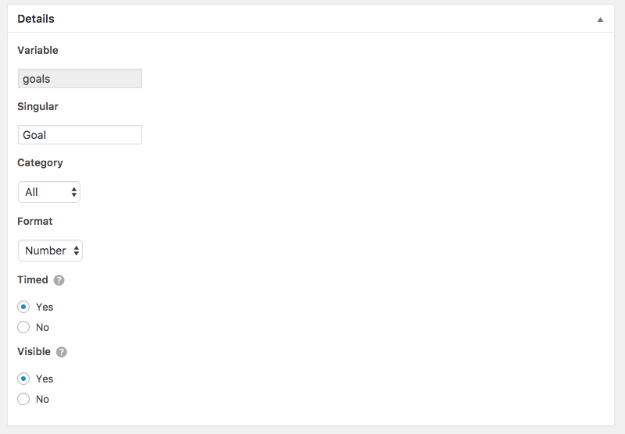
Under Player Performance section, click on each metric and ensure the checkbox next to Timed is set to Yes.
You can also edit each metric to have its own color and icon or you can upload your own custom image.
2. Populating the timeline
To display a timeline for past events, click on Events, hover over the event you want to edit and select Edit. Scroll down to the Score Box section and enter the correct value into the columns for metrics you want to to display on the timeline.
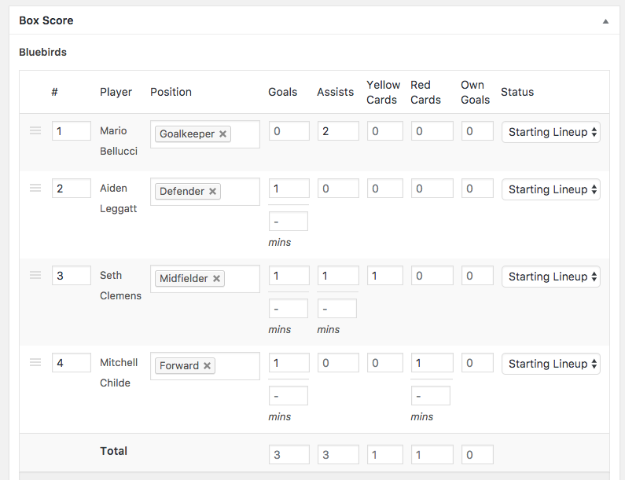
Update the Event and then scroll down to the Score Box section again to enter the minutes. If you need to adjust the Full Time for a particular event, enter the new event length and then click on Update Event.
If you look at your published event or a match now, you’ll see the timeline displays in a visual way, allowing your fans to get an instant insight into deciding moments of a game.
Each time you add a new event, simply repeat the steps above to populate the timeline and display it on the event page.
Wow Your Fans With Timelines
A visual timeline is a great way to display the most important moments in any game and in any sport. When you pair it with subtle visual cues like icons and colors, it makes the data even easier to understand.
Now that you know how to display a timeline for any event on your team website, it’s time to show off those timelines. Download the latest version of SportsPress Pro from your account area and don’t forget to download our cheat sheet that will help you set it up on your site.